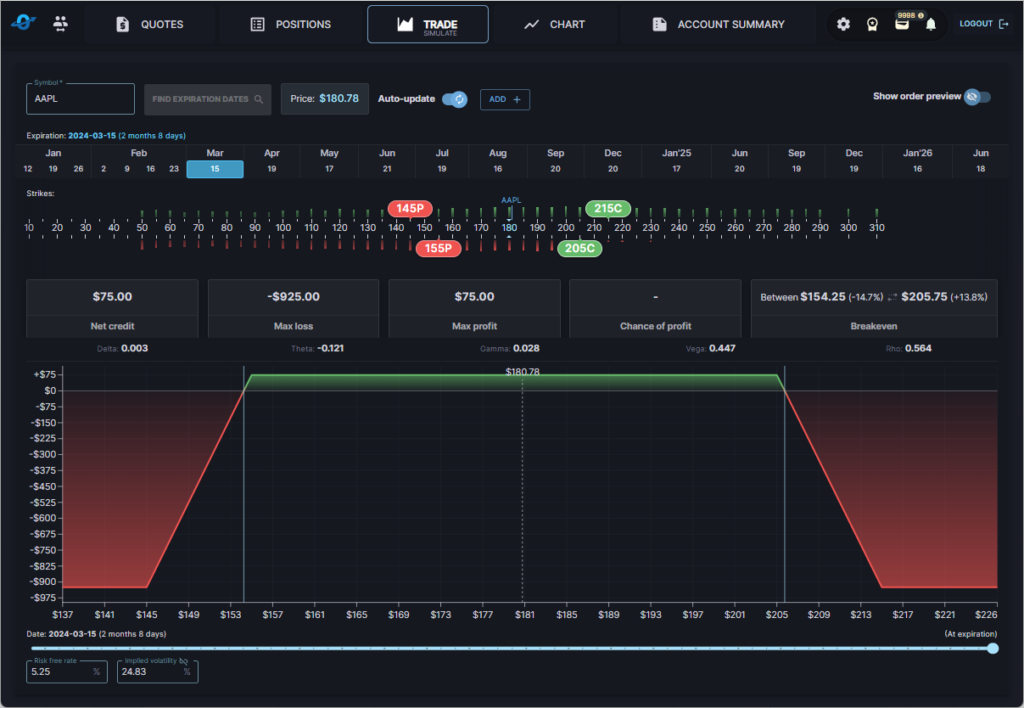
Everyone that trades options should understand their risk before entering the trade. This is a good rule of thumb for every investment, but critical for options. For new traders that are filled with optimism, they will tend to focus on the profits and ignore the potential of a loss. Our options profit calculator provides a profit and loss graph. This is often referred to as a risk graph to show how the selected option(s) profits as the stock price moves with or against the option. The Option profit on the y-axis(vertical) adjusts to the stock price movement on the x-axis(horizontal).

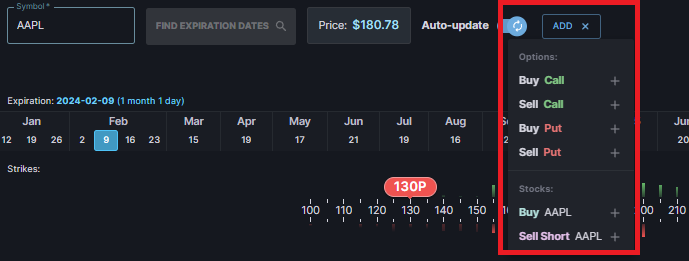
First we need to select a stock(symbol) that we want to trade(red box bow). Once you select the stock, the stock’s options data is loaded below.

Then we need to select the length of time (expiration)for the option that we want to trade. All of the expirations are listed from left to right with the left being the shortest available expiration and the right being the longest. Some stocks may have more expirations like daily or weekly expirations, while others may only have monthlies. The more popular the stock options are the more choices there are!
Add Option
Once you have selected your expiration, then you can choose from the pull menu to add long call, short call, long put, short put and long and short stock. This allows you to build simple to complex option strategies based off of the most current data.
Open interest
The green and red lines represent that strikes open interest on the call side(green) and put side(red).

Strike Selection
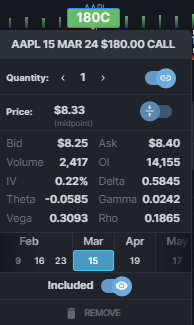
You can use the slider to easily adjust your options strike or quickly change the expiration you want to trade. You can click on the strike bubble(green 180c bubble below) to get more information on that option. You can see the quantity, bid, ask, implied volatility(IV), the greeks(Delta, Gamma, Theta, Vega, and Rho). You can also link the quantity to another option for a spread. You can choose to a different expiration for different legs of a spread as well.
To remove an option Position from the simulation, you can click on the strike bubble and choose to not include in the calculation or remove it completely.
Spreads or Multi Leg Strategies
Most beginners will start with a long call to understand their risks and profit zones. The term “moneyness” defines the position of the strike compared to the stock price. A strike that is very close to the stock price would be considered “at-the-money”. A call strike that is above the stock price would be “out-of-the-money” while a call strike that is below the current stock price would be considered “In-the-money”. For puts, a position that bets on the stock going down, the money is reversed. The “in-the-money” options would be above the current stock price while the “out-of-the-money” strike would be below the current stock price.
To test out different strategies you can use the same add button to test different options against you original trade. Below is an example of an Iron Condor.
Adjustable Variables
A unique feature to the Options Robot’s options profit calculator is the ability to adjust the inputs into the options model. Variables: time left in the trade(days to expiration), the risk free rate, and implied volatility. These can all be adjusted to see how your trade profit and loss would be affected by changes in each variable.

Aggregated Risks
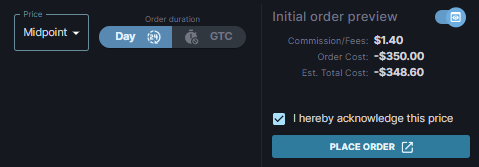
Some additional terms that the option profit calculator provides is the net debit or credit for your current option selections. The option price defaults to the mid point but you may want to manually change this if you entered at a different price or want to simulate a different price. A debit means that you are buying the options and have a capital outlay for that purchase. A net credit means that you have sold options and are bringing money into the account. This is different from margin when trading. Max Loss and Max profit are maximum profit and loss in the position. Breakeven(s) are where your position will have zero profit or loss. Some strategies could have more than one breakeven depending on the strategies. You can also see the aggregated greeks as well.

Brokerage Connection
If you have your brokerage connected and like the position that you have simulated then you can send your order to your brokerage by clicking the show order preview, then select trade criteria for order details then click send.
OPTIONS ROBOT is a suite of analysis and trading tools (referred to as the “TRADING PLATFORM” or simply the “PLATFORM”) designed to assist active traders and investors in applying their strategies intelligently in the marketplace. OPTIONS ROBOT does not recommend any securities to buy or sell. OPTIONS ROBOT offers neither trading nor investment advice. The OPTIONS ROBOT platform in its entirety, and the market data feeds that support the platform, are provided “AS-IS” and WITHOUT WARRANTY.
Please see our Terms of Service, Customer Contract and Market Data Disclaimers for additional disclaimers.
As should always the case, we urge users to perform their own careful due diligence and research before making any trading or investing decisions.
