In the dynamic world of option trading, where precision and timing are crucial, technical analysis emerges as a powerful tool to help traders make informed decisions. Whether you’re a seasoned pro or a newcomer to the options market, understanding how to leverage technical analysis can significantly enhance your trading strategy. In this blog post, we’ll delve into how technical analysis can assist option traders in timing their entries, managing their trades, and executing their exits effectively.
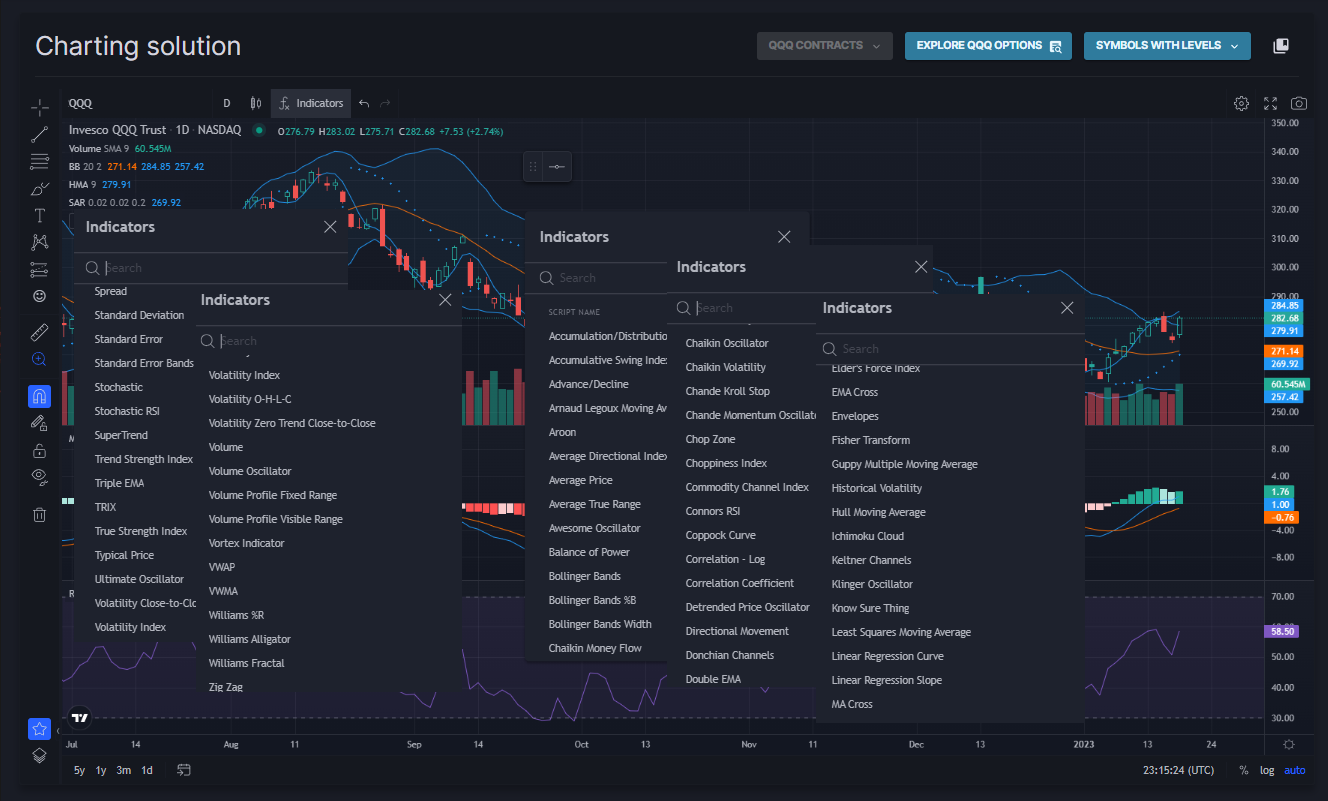
Technical analysis involves studying historical price data and trading volumes to forecast future price movements. Unlike fundamental analysis, which examines a company’s financial health and economic factors, technical analysis focuses on chart patterns, trends, and statistical measures. For option traders, technical analysis can provide insights into market sentiment and potential price action, helping them make strategic decisions.
Technical analysis helps traders identify trends in the underlying asset, which is crucial for timing entry points. By using tools like moving averages (MA), traders can discern whether an asset is in an uptrend, downtrend, or ranging. For instance, a trader might use a 50-day MA crossing above a 200-day MA (a “golden cross”) as a signal to enter a call option.
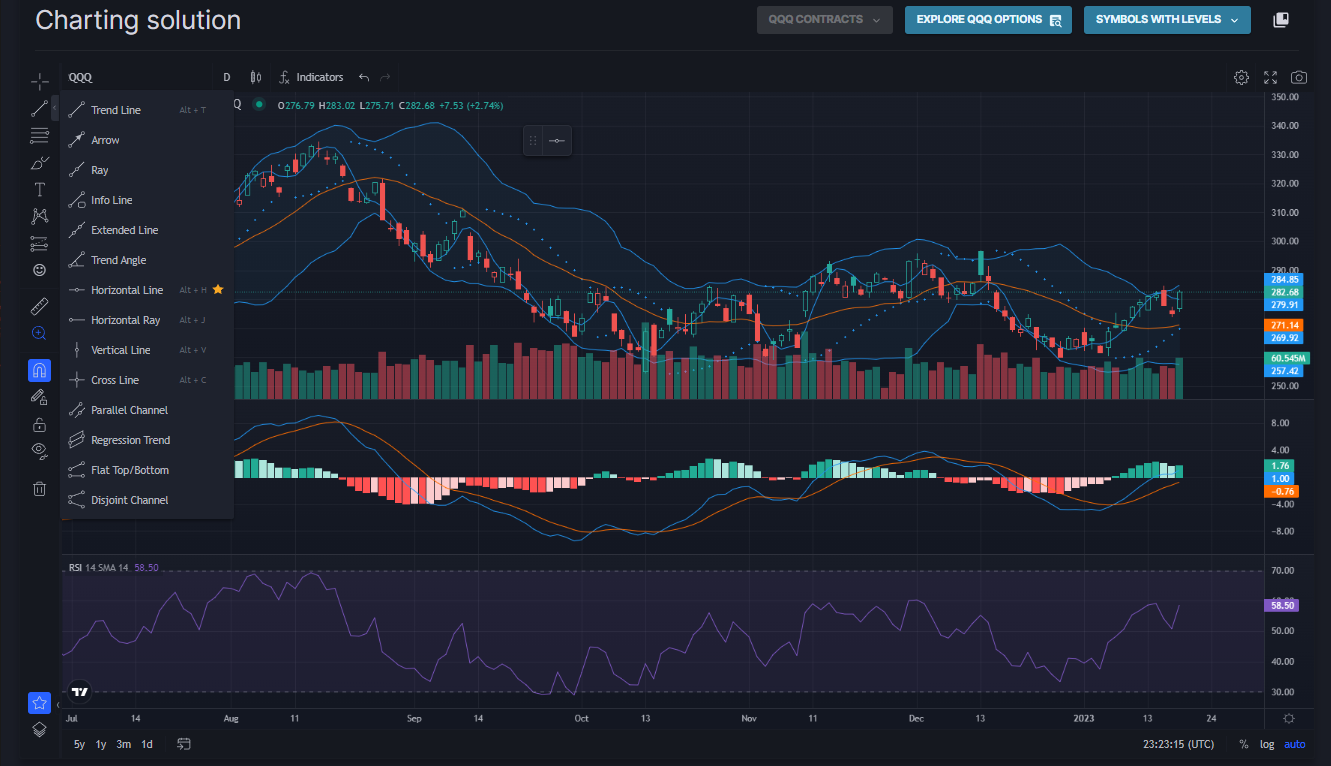
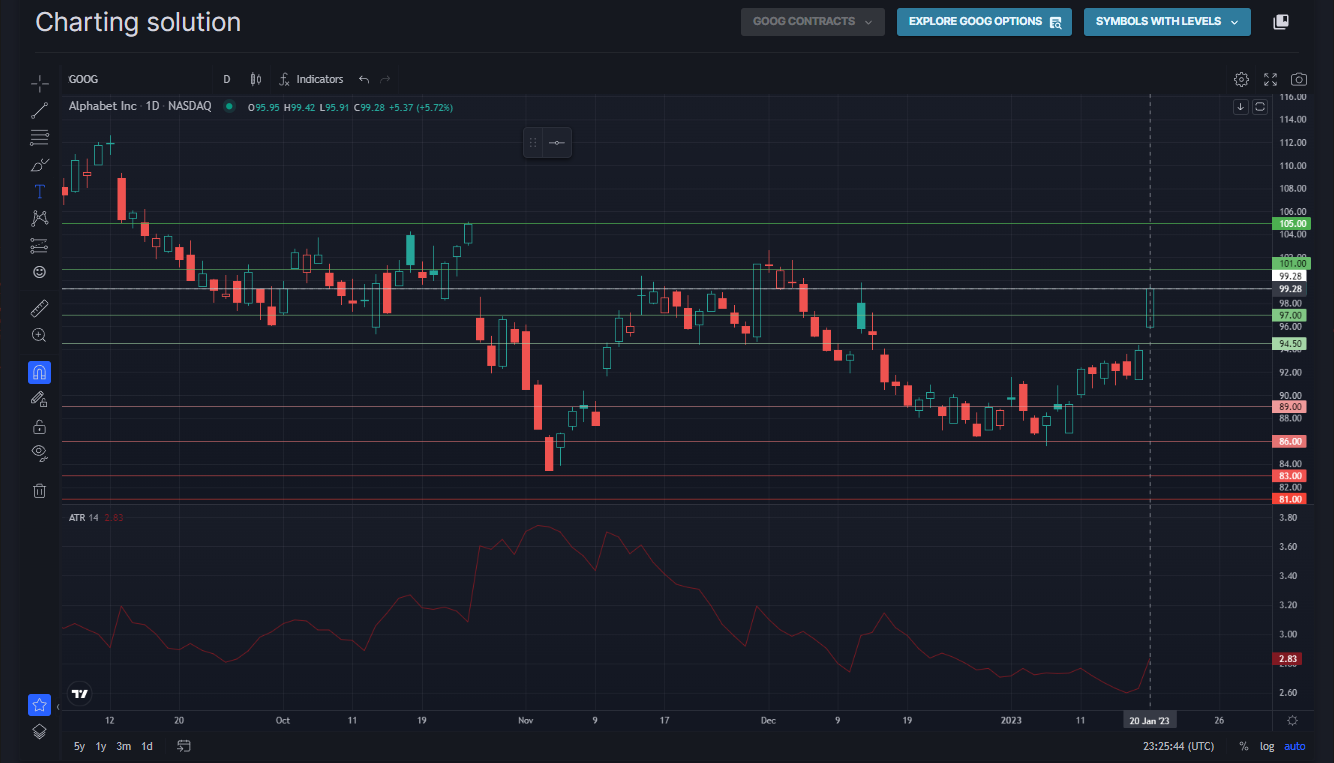
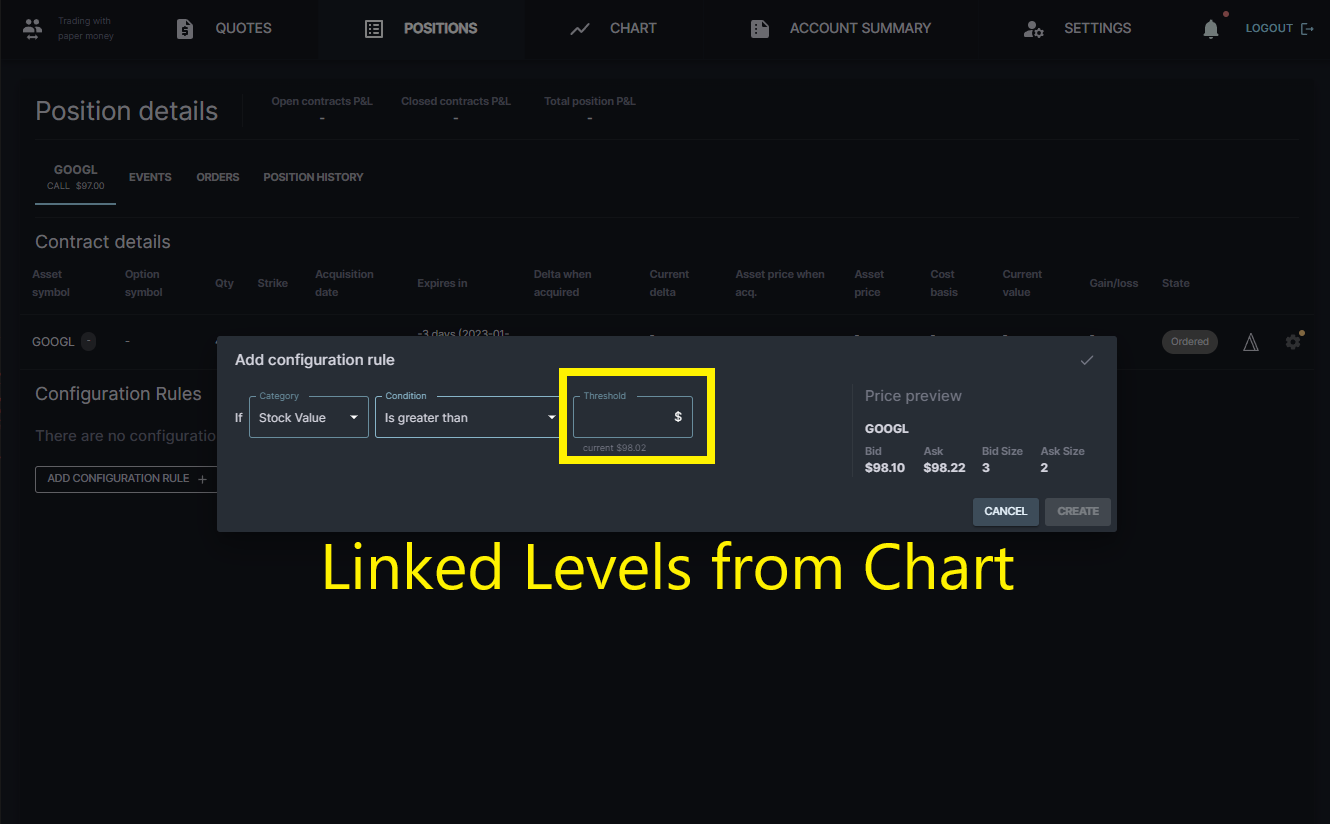
Key support and resistance levels are critical for determining entry points. Support levels indicate where an asset typically finds buying interest, while resistance levels represent areas where selling pressure emerges. By analyzing these levels on a price chart, traders can identify potential entry points for options trades. For example, entering a call option near a strong support level might offer favorable risk-reward ratios.
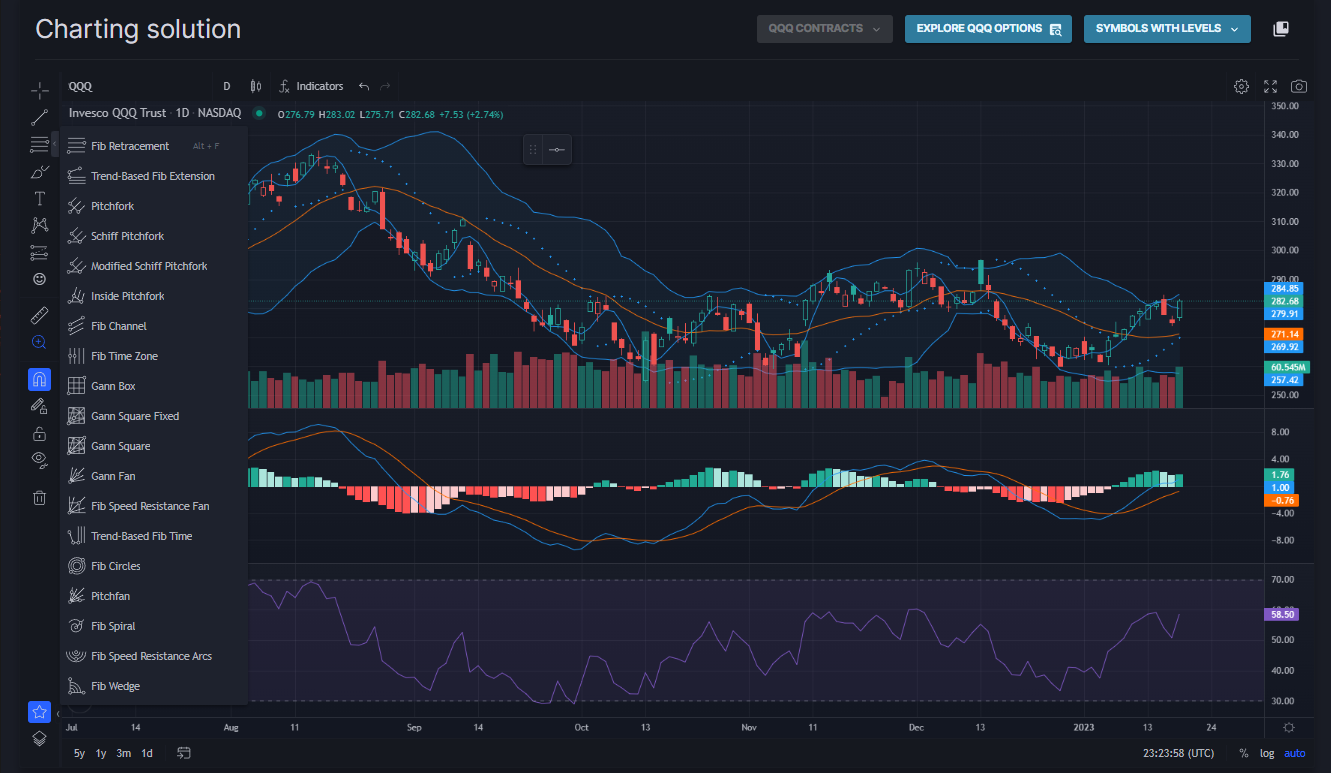
Technical analysis involves recognizing chart patterns such as head and shoulders, triangles, and flags. These patterns can signal potential breakouts or reversals, guiding traders on the optimal time to enter a position. For example, a breakout from a bullish flag pattern could suggest a good time to buy call options.
Effective trade management involves setting clear stop-loss and take-profit levels. Technical indicators like Average True Range (ATR) can help traders determine volatility and set appropriate stop-loss orders. Similarly, traders can use resistance levels to set take-profit targets. Managing trades with technical analysis helps limit losses and lock in profits.
Tools such as the Relative Strength Index (RSI) or Moving Average Convergence Divergence (MACD) provide insights into the strength and momentum of a trend. For instance, an overbought RSI might suggest that an underlying asset is due for a pullback, signaling a potential time to adjust or exit a trade.
As market conditions evolve, traders can use technical analysis to adjust their positions. For example, if an asset is showing signs of a trend reversal, traders might consider rolling their options positions or adjusting their strike prices to align with the new trend.
Technical analysis can help identify optimal exit points by analyzing price levels and chart patterns. For instance, if an asset reaches a key resistance level or forms a bearish reversal pattern, it might be an ideal time to sell a call option or exit a bullish position.
Implementing trailing stops can help lock in profits as an asset’s price moves in your favor. Technical indicators like moving averages can serve as dynamic trailing stops, allowing traders to ride trends while protecting gains.
Volume can provide additional confirmation of potential exit points. For example, a surge in volume at a resistance level might indicate that the price is likely to reverse, suggesting it could be a good time to exit.
Technical analysis is an invaluable tool for option traders seeking to refine their entry, management, and exit strategies. By leveraging trend analysis, support and resistance levels, chart patterns, and key indicators, traders can make more informed decisions and enhance their trading performance. Remember, while technical analysis provides valuable insights, it’s essential to combine it with sound risk management practices and stay updated on market news and events.
Happy trading, and may your technical analysis lead you to greater success in the options market!
Remember to adjust or add any specific technical tools or strategies that align with your trading style. If you are not trading trending stocks then adjust your tools to find better opportunities!
Delayed data for the free version and real time data available with a brokerage connection!
OPTIONS ROBOT is a suite of analysis and trading tools (referred to as the “TRADING PLATFORM” or simply the “PLATFORM”) designed to assist active traders and investors in applying their strategies intelligently in the marketplace. OPTIONS ROBOT does not recommend any securities to buy or sell. OPTIONS ROBOT offers neither trading nor investment advice. The OPTIONS ROBOT platform in its entirety, and the market data feeds that support the platform, are provided “AS-IS” and WITHOUT WARRANTY.
Please see our Terms of Service, Customer Contract and Market Data Disclaimers for additional disclaimers.
As should always the case, we urge users to perform their own careful due diligence and research before making any trading or investing decisions.